Giovanni Cincilla discusses Unveiling Biological Targets with KNIME in a new Blog series on Medium

Table of Content
• Introduction
• Compound determination
• User-defined compound set
• Reference compound(s) nearest neighbours
• Reference target active compounds
• Activity data retrieval
• Activity data representation
• How to run the workflow
• Acknowledgements
Introduction
Often, we need to analyse a set of compounds as a whole to identify the interaction profile they elicit with biological targets relevant in drug discovery. The compounds typically share common features, for example they may be:
- Chemically structurally similar
- Active in a biochemical or cellular assay
- Similar in their cellular morphology response profiles
- Similar when assayed in other phenotypic readouts
By examining these compounds as a cohesive group, we can gain valuable insights for various purposes such as: data introspection, biological profile determination, and both on‑ and off‑target deconvolution.
For such a necessity, at Healx we developed the Biological Target Profile workflow that leverages data from ChEMBL.
We can divide the workflow into three parts:
- Compound determination
- Activity data retrieval
- Activity data representation
Compound determination

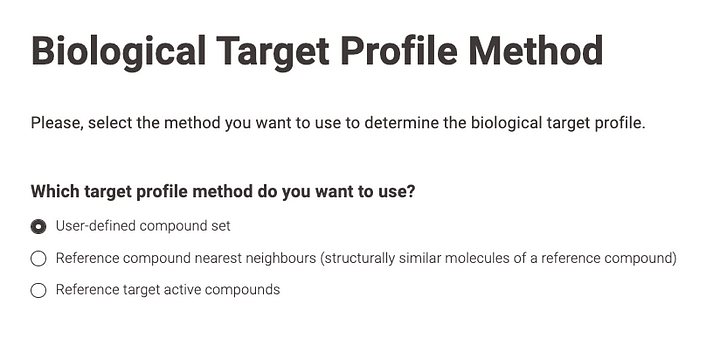
The compounds to use to build the biological target profile are defined in the first part of the workflow. We thought of three different potential scenarios:
- User‑defined compound set
- Reference compound(s) nearest neighbours
- Reference target active compounds
User-defined compound set
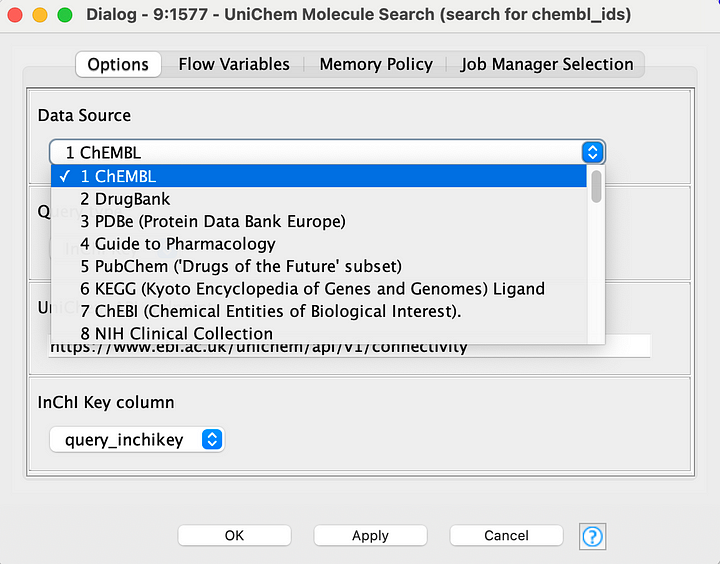
If the biological target profile is to be built from a user‑defined compound set, the molecular structures can be copied and pasted in the SMILES format or uploaded as a SMILES (in one of the following file formats: SMI, CSV, TSV, XLS, XLSX) or as a SDF file. The molecules are then cross‑matched with ChEMBL compounds using their InChI keys (generated with RDKit) and the publicly available UniChem API via a connectivity search.
This allows the user to choose whether to consider only the ChEMBL compounds that perfectly match the identity of uploaded molecules or to allow also specific compound variants such as different stereoisomers, tautomers, protonation states, etc.
The first option is the strictest and cross‑matches the compounds on the basis of full InChI key matches. The second option is looser, and the compounds are cross‑matched on the basis of the InChI key first block matching. Our two KNIME components that make most of the job (i.e., UniChem Molecule Search and UniChem Molecule Variants Selection) can be used to cross‑match compounds not only from ChEMBL but also from other very relevant data sources (e.g. DrugBank, PDBeChem, PubChem).
Reference compound(s) nearest neighbours
The second option for compound determination retrieves compounds from ChEMBL that are structurally similar to one (or a few) reference compounds of interest. Here, the user can choose whether to input the compounds in SMILES or SDF, from a file (using the same file formats as above), by copying and pasting the SMILES in a text editor or even sketching the reference compound through the KNIME Molecule Widget node that implements Ketcher.

Once the reference compound(s)’ structure is determined our KNIME component, ChEMBL Molecule Search, runs a similarity search using the ChEMBL similarity API. Such a component can be used also to search for compounds using a substructure search.

After the search is completed, the user can select compounds based on a similarity threshold (which is set to a default of 55 out of 100) as well as by manually selecting specific compounds to build the biological target profile.

Reference target active compounds
If the biological target profile is to be built from active compounds of a reference target, you can search for it by name. Basic information about the target is displayed on an interactive page. In this context, we define “target” in the same way that ChEMBL does, encompassing not only single protein targets but also various other types of targets, including both molecular (e.g., protein complexes, protein families, protein-protein interactions) and non-molecular (e.g., cell lines, tissues, organisms).

After selecting the target, the user has the option to choose the activity type based on which active compounds will be defined. Additionally, while a series of common drug-like molecule filtering steps will be performed, the user can choose whether to apply each filter at every step. The filters are based on compounds that have: uncommon elements, macrocyclic rings, very large molecular weights, and anomalous activity (i.e., activity with a range higher than a certain threshold, which is set to one log unit by default).
After these steps are completed, the user can select the active compounds based on both an activity threshold (defaulting to the top 0.3 quantile of the activity range) and by cherry-picking the compounds to use in building the biological target profile.

Activity data retrieval

Once the compound set for building the biological target profile has been defined, all activity data linked to the individual proteins of those compounds is retrieved using our KNIME component called ChEMBL Activity From Molecule Retrieval. This component retrieves the activities of all single protein targets and then performs a series of operations for data aggregation and rounding of activity values. The core of the component is the following SQL query:
WITH target_mutation_adjusted_data AS (
 SELECT
  cst.canonical_smiles,
  md.chembl_id AS molecule_chembl_id,
  td.tid, td.chembl_id AS target_chembl_id,
  td.target_type, td.organism AS target_organism,
  td.pref_name AS target_name,
  cs.accession,
  CASE
    WHEN vs.mutation IS NULL
      AND vs.variant_id IS NULL
      AND ass.description ~* '.*(muta(nts?|tions?|ted)|variant).*'
    THEN 'UNDEFINED MUTATION'
    ELSE vs.mutation
  END AS mutation,
  ass.confidence_score AS target_association_score,
  csl.description AS target_association,
  act.activity_id,
  ass.assay_id,
  ass.assay_test_type,
  at.assay_desc AS assay_type,
  ac.class_type AS phenotypic_assay_type,
  ac.l1 AS phenotypic_assay_high_level_classification,
  ac.l2 AS phenotypic_assay_mid_level_level_classification,
  ac.l3 AS phenotypic_assay_fine_grained_level_classification,
  act.standard_type,
  act.standard_relation,
  act.standard_value,
  act.standard_units,
  act.data_validity_comment,
  act.activity_comment
 FROM
  molecule_dictionary md
 JOIN
  compound_structures cst ON cst.molregno = md.molregno
 JOIN
  activities act ON act.molregno = md.molregno
 JOIN
  assays ass ON ass.assay_id = act.assay_id
 JOIN
  confidence_score_lookup csl ON csl.confidence_score = ass.confidence_score
 JOIN
  assay_type at ON at.assay_type = ass.assay_type
 LEFT JOIN
  assay_class_map acm ON acm.assay_id = ass.assay_id
 LEFT JOIN
  assay_classification ac ON ac.assay_class_id = acm.assay_class_id
 JOIN
  target_dictionary td ON td.tid = ass.tid
 LEFT JOIN
  target_components tc ON tc.tid = td.tid
 LEFT JOIN
  component_sequences cs ON cs.component_id = tc.component_id
 LEFT JOIN
  variant_sequences vs ON vs.variant_id = ass.variant_id
 WHERE
  act.standard_value IS NOT NULL
 AND
  ass.confidence_score >= $${Imin_target_confidence_score}$$
)
SELECT
 *
FROM
 target_mutation_adjusted_data
The query uses a Common Table Expression (CTE) to adjust mutation data and assign the label ‘UNDEFINED MUTATION’ to the mutation field of targets associated with assays whose descriptions contain terms such as “mutated,” “mutation,” “variant,” etc. A similar approach has been employed in the work of other authors to reduce noise from data prior to ChEMBL version 22, when target mutation information was not systematically extracted and captured in the ChEMBL variant_sequences table.
The variable called min_target_confidence_score represents the minimum threshold for the ChEMBL confidence_score value found in the assays table of ChEMBL. This value indicates how accurately the assigned target(s) represent the actual assay target and is linked to the target type. In this workflow, the min_target_confidence_score is set to 9, which is the maximum, because we want to retrieve only the activity of directly assigned single protein targets.
The ChEMBL Activity From Molecule Retrieval component initially retrieves all activity data associated with the input molecules. However, to ensure the selection of only high-quality activity data, a subsequent filtering stage is implemented. This approach aligns with methodologies used by other researchers. Only activity data meeting the following stringent criteria are retained and considered:
- standard_type = IC50, EC50, AC50, XC50, Ki, Kd, Potency, ED50
- standard_relation equal to “=”
- Missing values in data_validity_comment field
- activity_comment field different from: “inconclusive”, “undetermined”, “unevaluated”
Activity data representation

After gathering and filtering all the relevant activity data as indicated above, we present it using two informative and interactive diagrams.
The first diagram is a target-ligand interaction heat map, which includes a list of compounds displayed as table row IDs (hovering over an ID reveals the corresponding molecular structure) and various targets and their variants represented as columns.
The colour of each cell indicates the strength of the defined activity, with hotter colours signifying higher activity levels. This diagram is particularly useful for quickly identifying potential patterns, both in terms of specific ligands binding to the defined targets and target variants (row-wise) and in terms of specific targets being bound by the defined ligands (column-wise). Each column corresponds to a single target variant, allowing for clear differentiation of data from various organisms or target mutations.

The ligand-target activity data used to create the heat map is displayed at the bottom of the same web app page, along with detailed information such as literature references, DOIs, assay types, assay descriptions, and more.

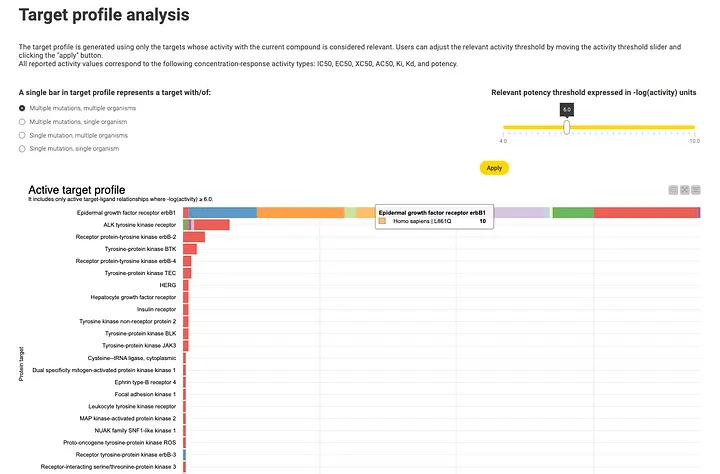
The second diagram illustrates the target profile using a bar chart. Each bar represents the number of compounds that interact with a specific target or target variant at a given potency. The potency threshold, expressed as the negative logarithm of potency (e.g. pIC50), is initially set by default to 6, being 1 μM, but users can modify it interactively. By default, each bar represents a target in its broadest sense, encompassing multiple possible mutations and different organisms. However, users have the flexibility to adjust this representation to focus on a narrower definition, which includes a single variant and organism, as well as options in between.
This diagram allows for the analysis of the biological target profile of the compound set under examination, highlighting the targets and target variants that may be involved in the interactions of the compound set within a biological process. It has the potential to confirm existing hypotheses or reveal unexpected/unknown relationships.
Finally, the results, including both data and diagrams, can be downloaded from the web application in CSV/XLSX and SVG file formats, respectively. If the XLSX file format is chosen for the data, the compounds’ molecular structures are reported not only as SMILES (as in the case of the CSV file) but also depicted as PNG images embedded in the spreadsheet.


How to run the workflow
The workflow can be found here and is almost ready to be run. The only task remaining is to configure our ChEMBL DB Connection component at the beginning of the workflow to point to a running version of the ChEMBL database. This involves entering the database username, password, host, version, and port.
Alternatively, database credentials can also be retrieved from the KNIME Hub instance, the name of which should be specified in the dialog of the ChEMBL DB Connection component. For this option, the credential retrieval mode of the node should be set to “Retrieve from specified KNIME Hub instance”. To use this option, the credentials on the KNIME Hub should be named chembl_credentials.

The recommended database version is chembl_35, which is the latest version at the time of writing. However, we intend to update the workflow to accommodate future database versions as needed.
Once the ChEMBL DB Connection component is configured, the workflow can be run on a KNIME Hub instance as a web application or locally by interacting with the Interactive View of all the components which represent a web page in the application. These components are marked with a workflow annotation in cyan with a “WebPortal” tag.

Acknowledgements
We would like to thank the open data and open source community for providing the data and some of the tools that were used to implement this workflow, without which it would not have been possible. More specifically, we would like to thank the RDKit community, the ChEMBL & UniChem teams, and the KNIME Team.